ProbSc@r™ is a specific module of the cloud-based rocsc@r® software that allows you to perform 2D probabilistic-based scour computations.
Risk-informed analysis and decision-making processes related to safety and stability of hydraulic structures study the probability of occurrence of potential failure modes (PFMA). The probability of a given scour depth to be reached during the lifetime of the structure, or following a distinct flood event, is of particular importance. The uncertainty inherent to the many input parameters responsible for scour formation asks for a probabilistic-based computational approach, such as the Monte Carlo method.
The Monte Carlo method makes use of a large number of successive computations, whereby the hydraulic and geomechanic input parameters are determined for each run based on a probability density function defined by the user.
This process generates many probable outcomes, which become more accurate as the number of inputs grows. The different outcomes are generally considered to form a normal distribution, which allows to determine a likelihood of appearance for each of the computed outcomes.


Key features
- Probabilistic-based 2D rock scour with time
(Monte-Carlo simulation) for plunging jets - Choice of scour method (EIM, CFM, MDI, MQSI, etc.)
- Input hydrographs with time
- Regressive scour (head-cut) with time (CFM)
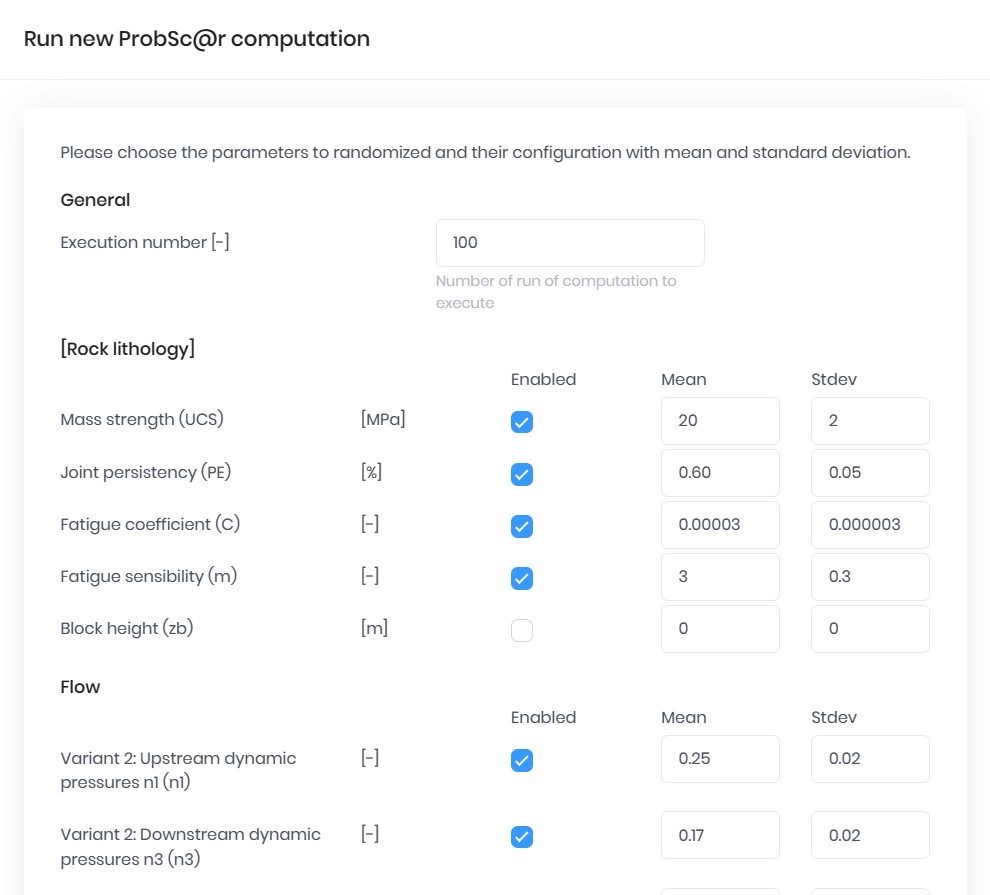
- User-customizable variability for a wide range of input parameters (rock lithologies, flow)
- User Interface and 2D graphical/file outputs
- Video of time evolution of output
- Error / Confidence Interval / Number of runs
ProbSc@r™ has been used to compute the 2D scour hole downstream of Chucas Dam in Costa Rica following the 2017 100-year return period flood event. A total of 100 runs have been done using the Comprehensive Fracture Mechanics method and making use of 7 stochastically defined parameters, i.e. UCS strength, fatigue coefficient C, fatigue exponent m, initial joint persistency PE, and pressure distribution parameters over the interface.
The movie on the right-hand side shows the 2D time evolution of scour formation during the 24h duration flood event for all 100 runs, together with the statistical minimum, mean and maximum scour hole shapes.
